B2B Customer Journey Management using Marketing Dashboards – part 1


Companies that have a customer journey management program in place outperform companies that don’t (source: Aberdeen Group). However, research from CMO Council reveals that 95% of marketing executives struggle with customer journey management and adaptability.
For many B2B marketers in the Netherlands it is still a challenge to connect marketing activities to company revenues. Now that more companies are embracing customer journey management, marketers face even more complexity in measuring marketing success. Instead of tracking only channel and campaign results, marketers now require insights into success of usage of different marketing tactics in the different customer journey stages.
SPOTONVISION developes a dashboard that helps B2B marketers to track and to optimize customer journey results. In order to have a good understanding of marketing performance in the different customer journey stages, from ‘awareness’ to ‘advocacy’, marketers need a dashboard consisting of six different views.
The six customer journey dashboard views:
- The customer journey monitor
- Demand generation view
- Lead nurturing view
- Sales enablement view
- Customer success view
- Profitability view
Over the next few months I will discuss each dashboard view in more detail.
Let’s start with the first view: the customer journey monitor.
Customer journey monitor
In order to manage and optimize customer journeys the first step is to get insight into current performance versus target. That is why the first view in the dashboard is the customer journey monitor. This view contains an overview of results versus target for each customer journey stage. Companies that do not yet have customer journey targets in place can compare current performance versus previous year’s performance.
In this view we focus on output. That is, the returns from the marketing activities in the different customer journey stages. The charts in the customer journey monitor can be different per company.
The following overview gives some direction to which charts to include in the monitor:
Awareness
In the awareness stage potential buyers engage with the content you promote via different channels. That is why for the awareness stage returns such as website and landing page visitors, downloads and the number of inquiries are important indicators.
Consideration
The new contacts that are gained through content in the awareness stage are served with more and in-depth content in the consideration stage. Depending on contact profile and engagement, the so-called lead score is built up automatically. Contacts that reach a certain lead score are considered marketing qualified and handed over to sales. Therefore, the number of marketing qualified leads is an important return metric for the consideration stage.
Decision
The decision stage is all about opportunities from marketing leads and the deals that are won and lost. Important return metrics here are the number of new opportunities, the number of deals won and total order intake from deals won.
Initiate, Engage & Advocacy
For the ‘initiate’ stage companies can look into return metrics such as number of new contracts, activations, repeat buys and value of repeat buys.
In the ‘engage’ stage, order intake from cross- and upsell campaigns can be an important return metric. For results regarding ‘advocacy’ companies can look into metrics such as the number of company advocates, the number of referrals and opportunities and order intake from referrals.
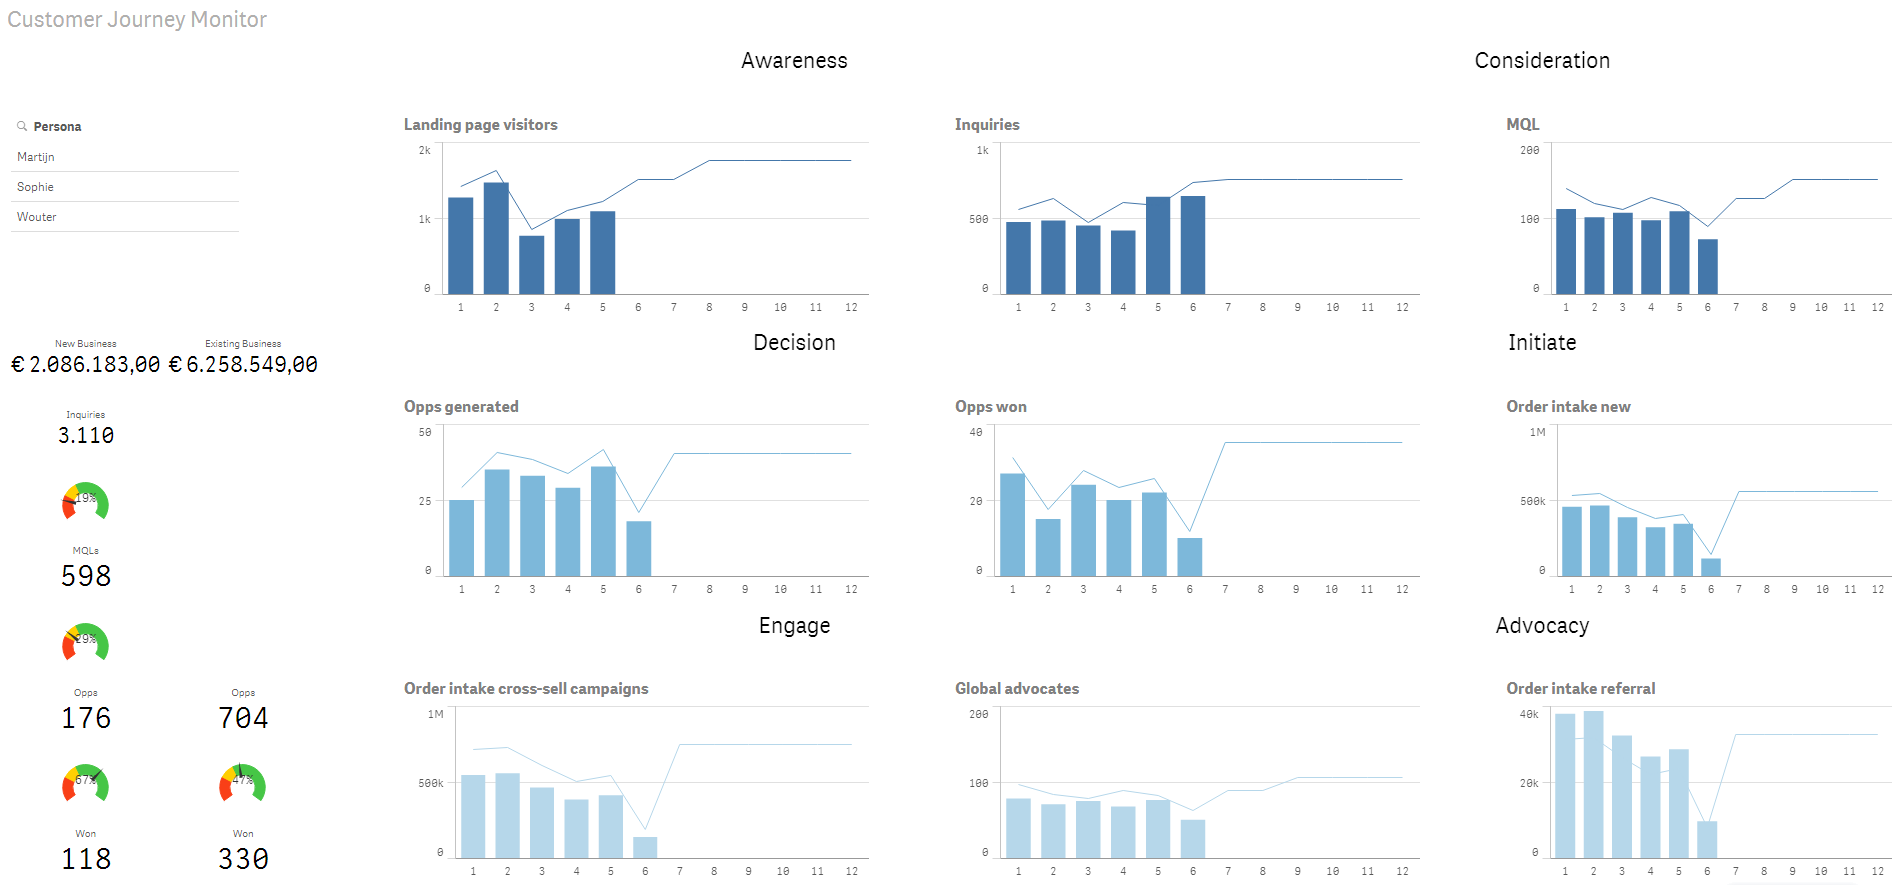
The customer journey view contains the total order intake and funnel conversion rates as well. This way marketers can see directly how monthly results compare to target for each stage in the customer journey. The conversion rates can help defining next steps to optimize results in the different stages.
Example view: Customer journey monitor
The customer journey monitor is the first view in the customer journey dashboard.
In the next blog I will discuss the second part of the dashboard, the demand generation view. The goal of this view is to get more actionable insights into effectiveness of the uses of content and promotion channels for different personas.
In case you have questions regarding measuring customer journey success or if you have a great idea about which charts should be included in this view: Don’t hesitate to give us a call or send us an e-mail.
Share this article
Related insights


Grow your B2B Marketing knowledge
Subscribe to keep up with our latest B2B Marketing updates and exclusive events. Straight to your inbox, once a month.